How to use i1 Profiler to make custom black and white profiles for QuadTone RIP

BLOG
Every Journey Needs a Journal
Most people use a 21 step (5% step) target for measuring and linearizing their QuadToneRIP profiles. Using the 21x4-random target is a step better, and I described this process in my post last year with instructions for using i1 Profiler to measure the linearization targets. While the 21-step target does a good-enough job with a 3 partition profile, sometimes a 51-step (2% K) target can show you where little bumps might be hiding between those 5% steps.
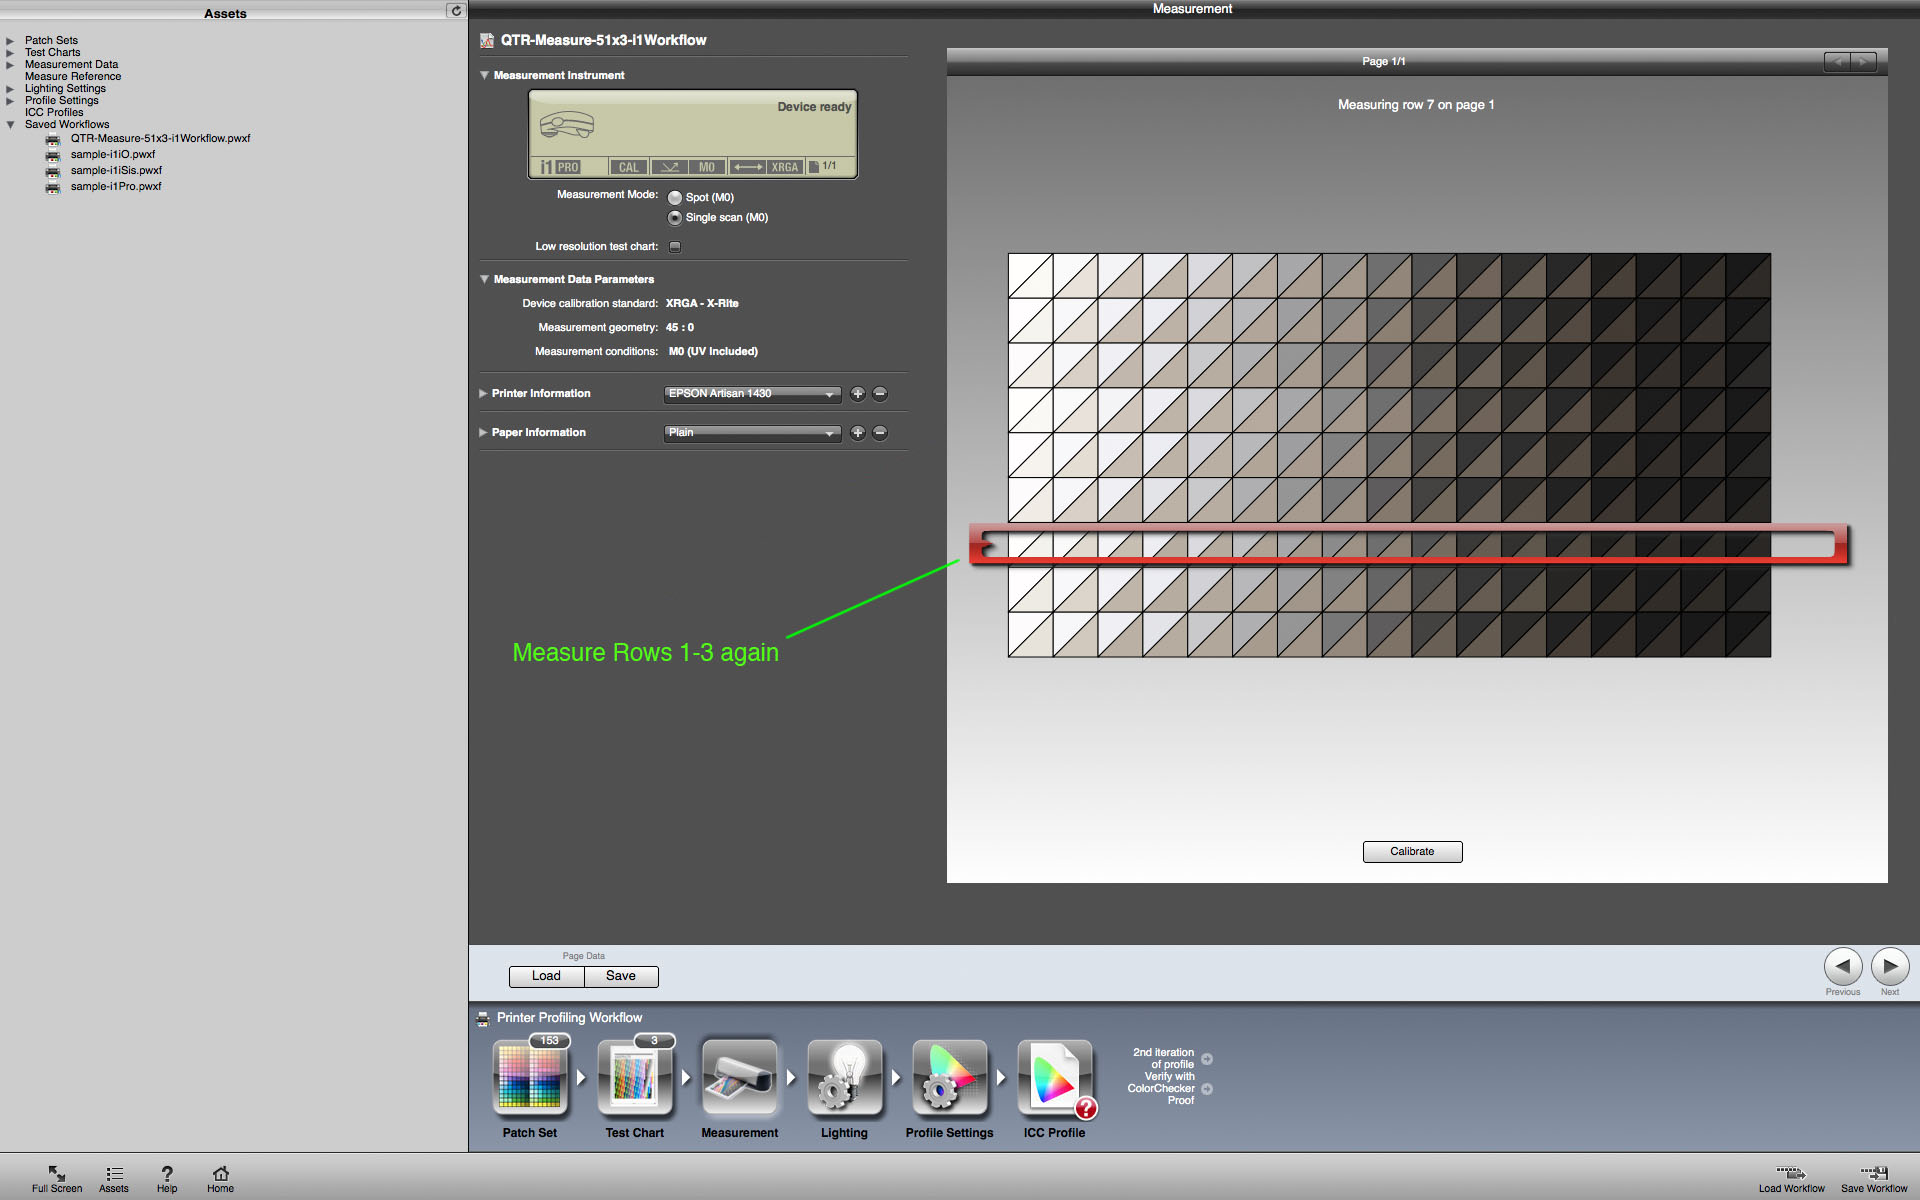
Measure a single patch a few times and you will see that it is usually off each time by a small percentage. Smaller steps will show more information, but can also show bumps in the curve where they might not actually exist. Those measurement errors need to be averaged out to determine if the problem is the actual ink distribution or inconsistencies in how the light reflects off the paper surface as the measuring device moves over each patch. After measuring thousands of patches over the last few years, I have settled on measuring each 51-step target 3 times. A 51x4 might be more accurate, but 9 passes seems to be about the limit of my patience… To make these averaging measurements easier, I have updated the 51-step 2% target included with QuadToneRIP so that it will work with i1 Profiler and the i1 Pro photospectrometer. The workflow allows you to measure the same target three times (measure row 1-3 once, and then go back and measure row 1-3 again when the on-screen instructions indicate measuring row 4-6, and measure it again when the instructions call for rows 7-9).
These instructions and screenshots were created on a Mac, but they are applicable to i1 Profiler for Windows. You will need to download the i1 Profiler from this Dropbox Link.
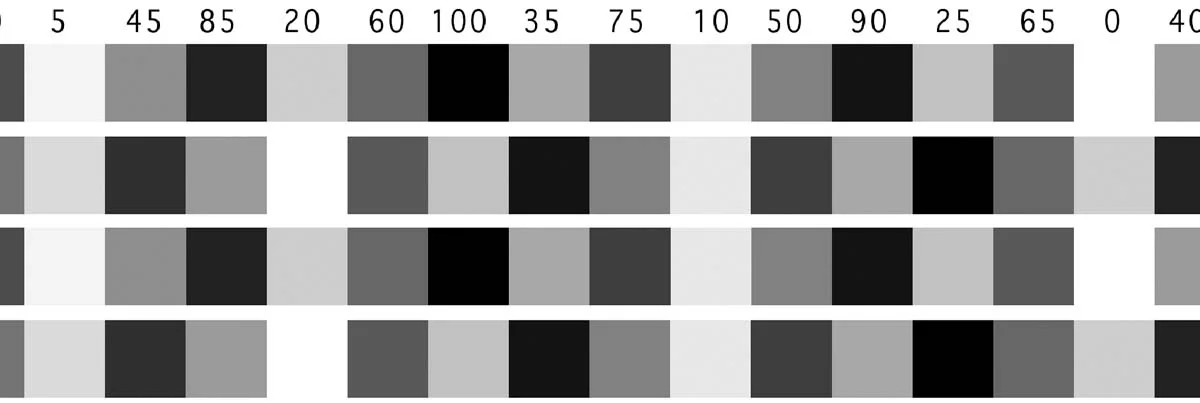
Print the 51-step target that is included in the downloaded zipfile from the QTRgui on windows or from PrintTool on Mac OSX and make sure to disable color managment. The larger format target that makes reading in strip mode requires you to print it in portrait orientation.
I suggest you create a folder on your desktop for the workflow and any saved measurement files. The default directory or folder for these files is buried in the Application Support folders on the Mac and in the Application Data (which is a hidden folder that can be revealed in the Tools>Folder Options Menu) in the Documents and Settings folder on Windows.
Mac:
Macintosh HD/Library/Application Support/X-Rite/i1Profiler/ColorSpaceRGB/PrinterProfileWorkflows
Windows:
C:\Documents and Settings\All Users\Application Data\X-Rite\i1Profiler\ColorSpaceRGB\PrinterProfileWorkflows
Drag workflow to this folder on Windows
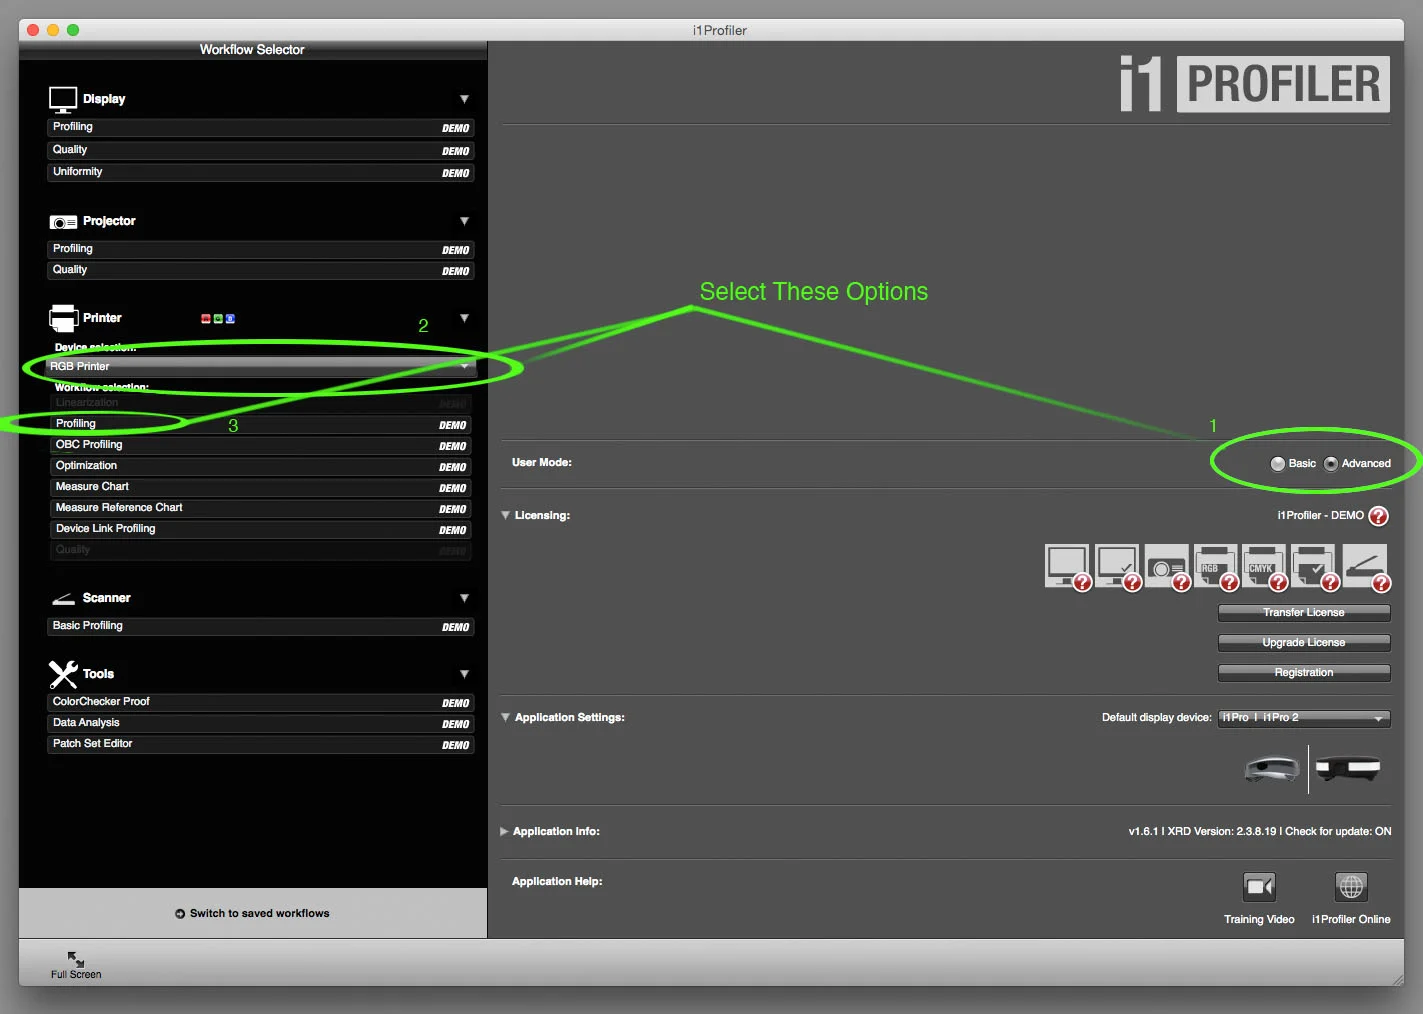
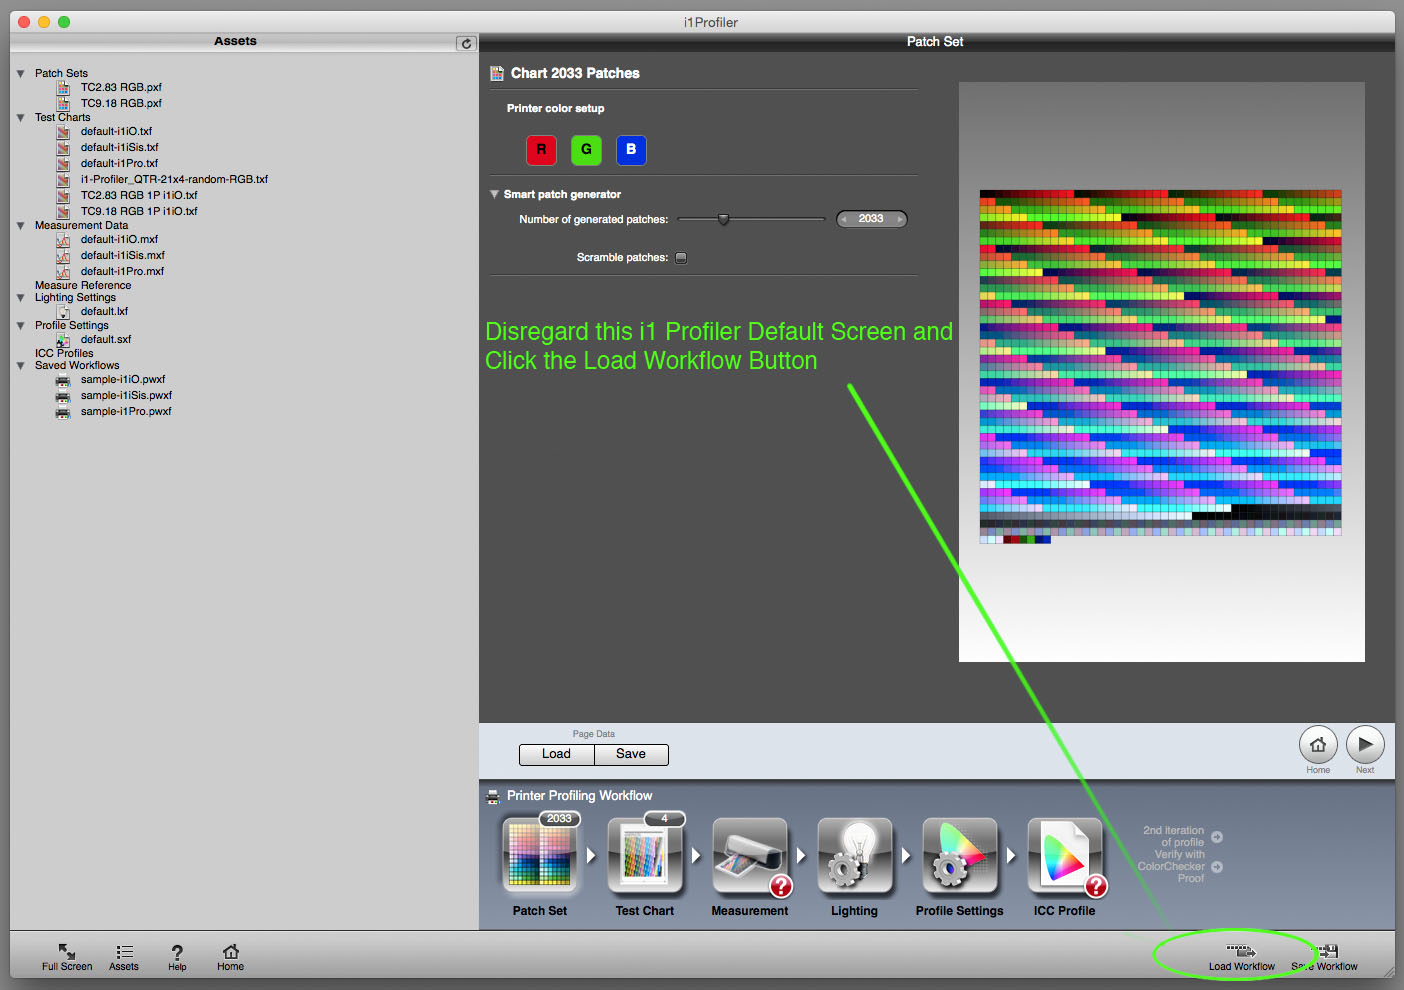
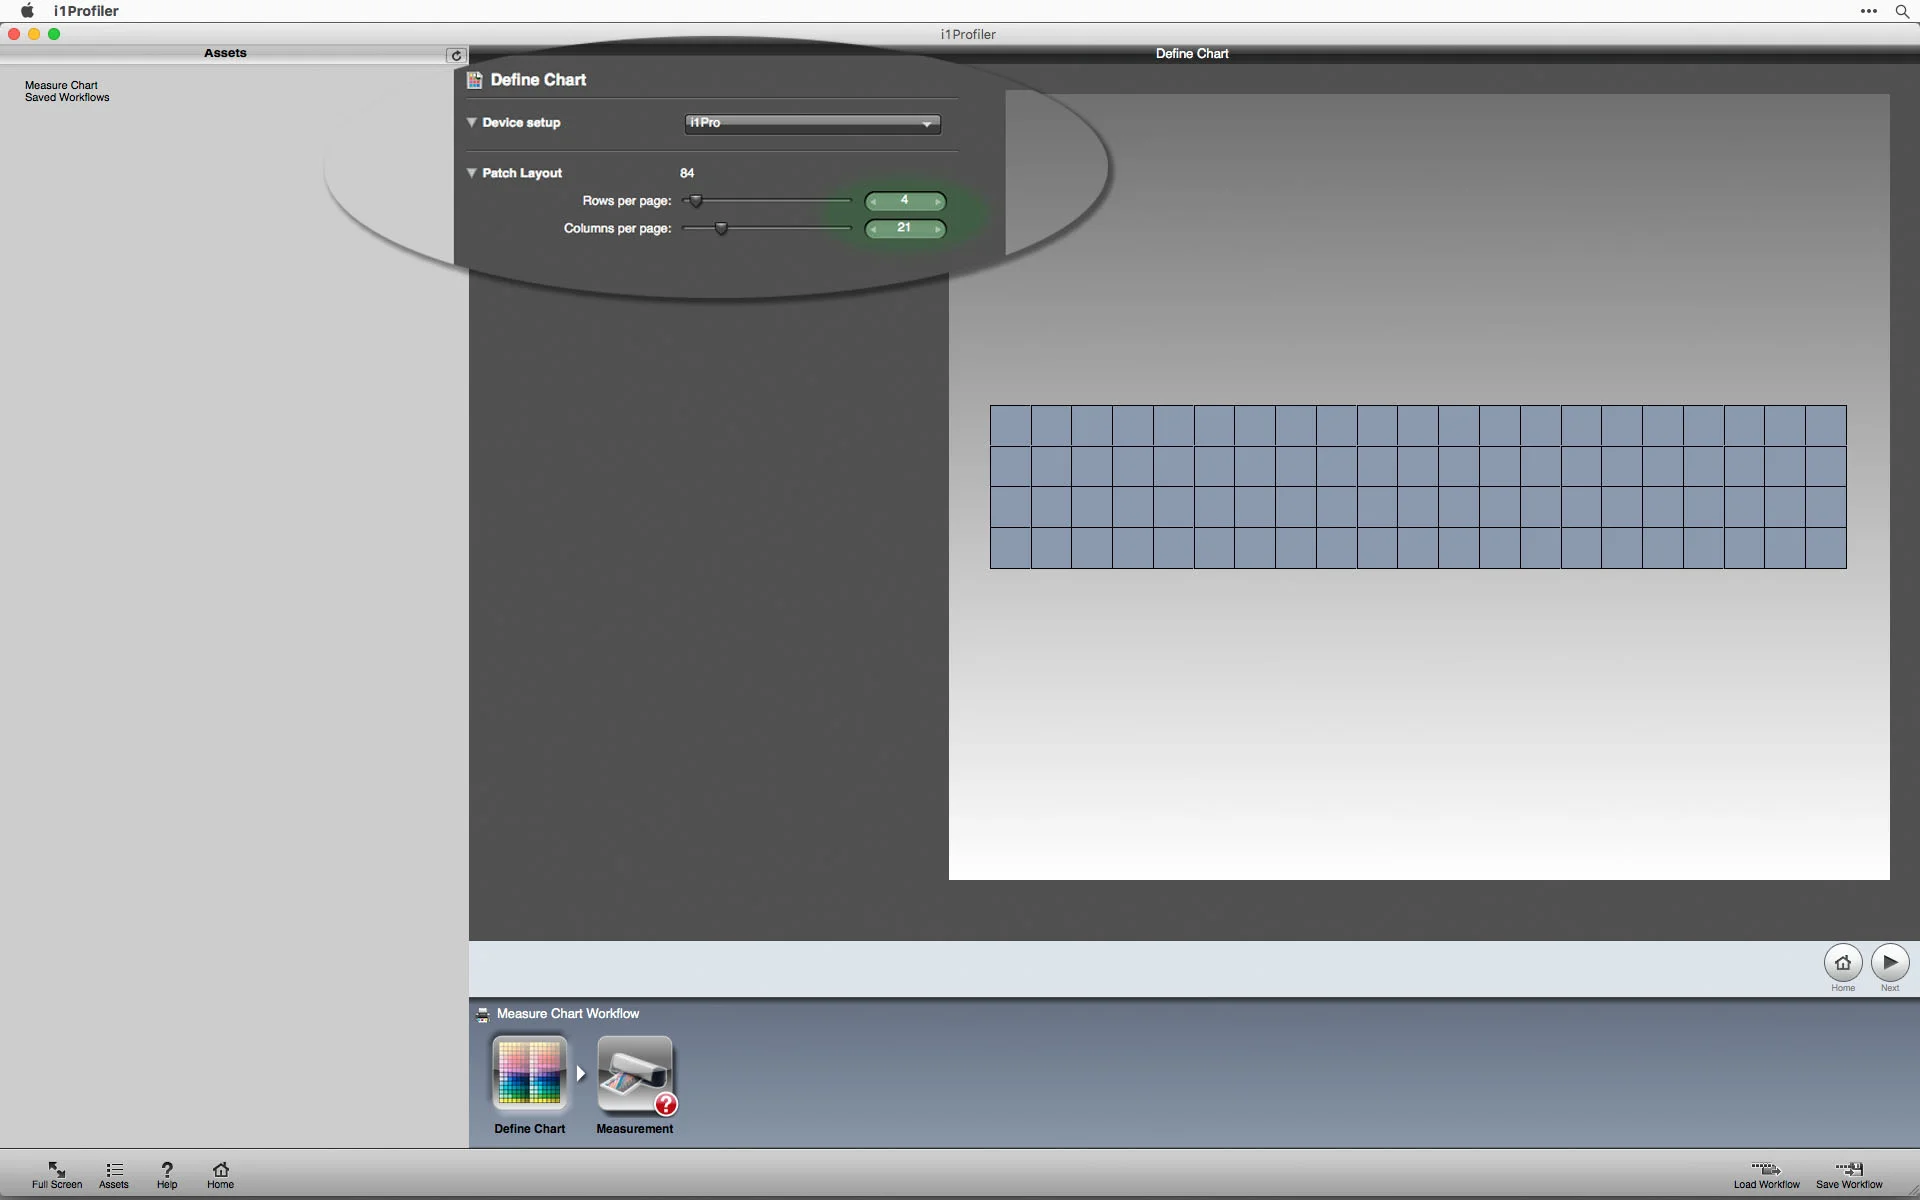
Launch the i1 Profiler Application and make sure you are in Advanced user mode. - Click either RGB or CMYK Printer - Click Profiling (this just gives you access to the next screen where you are able to load the saved workflow) - Alternatively, you can simply click "go to saved workflows" in the lower left portion of the screen.
To measure the chart three times:
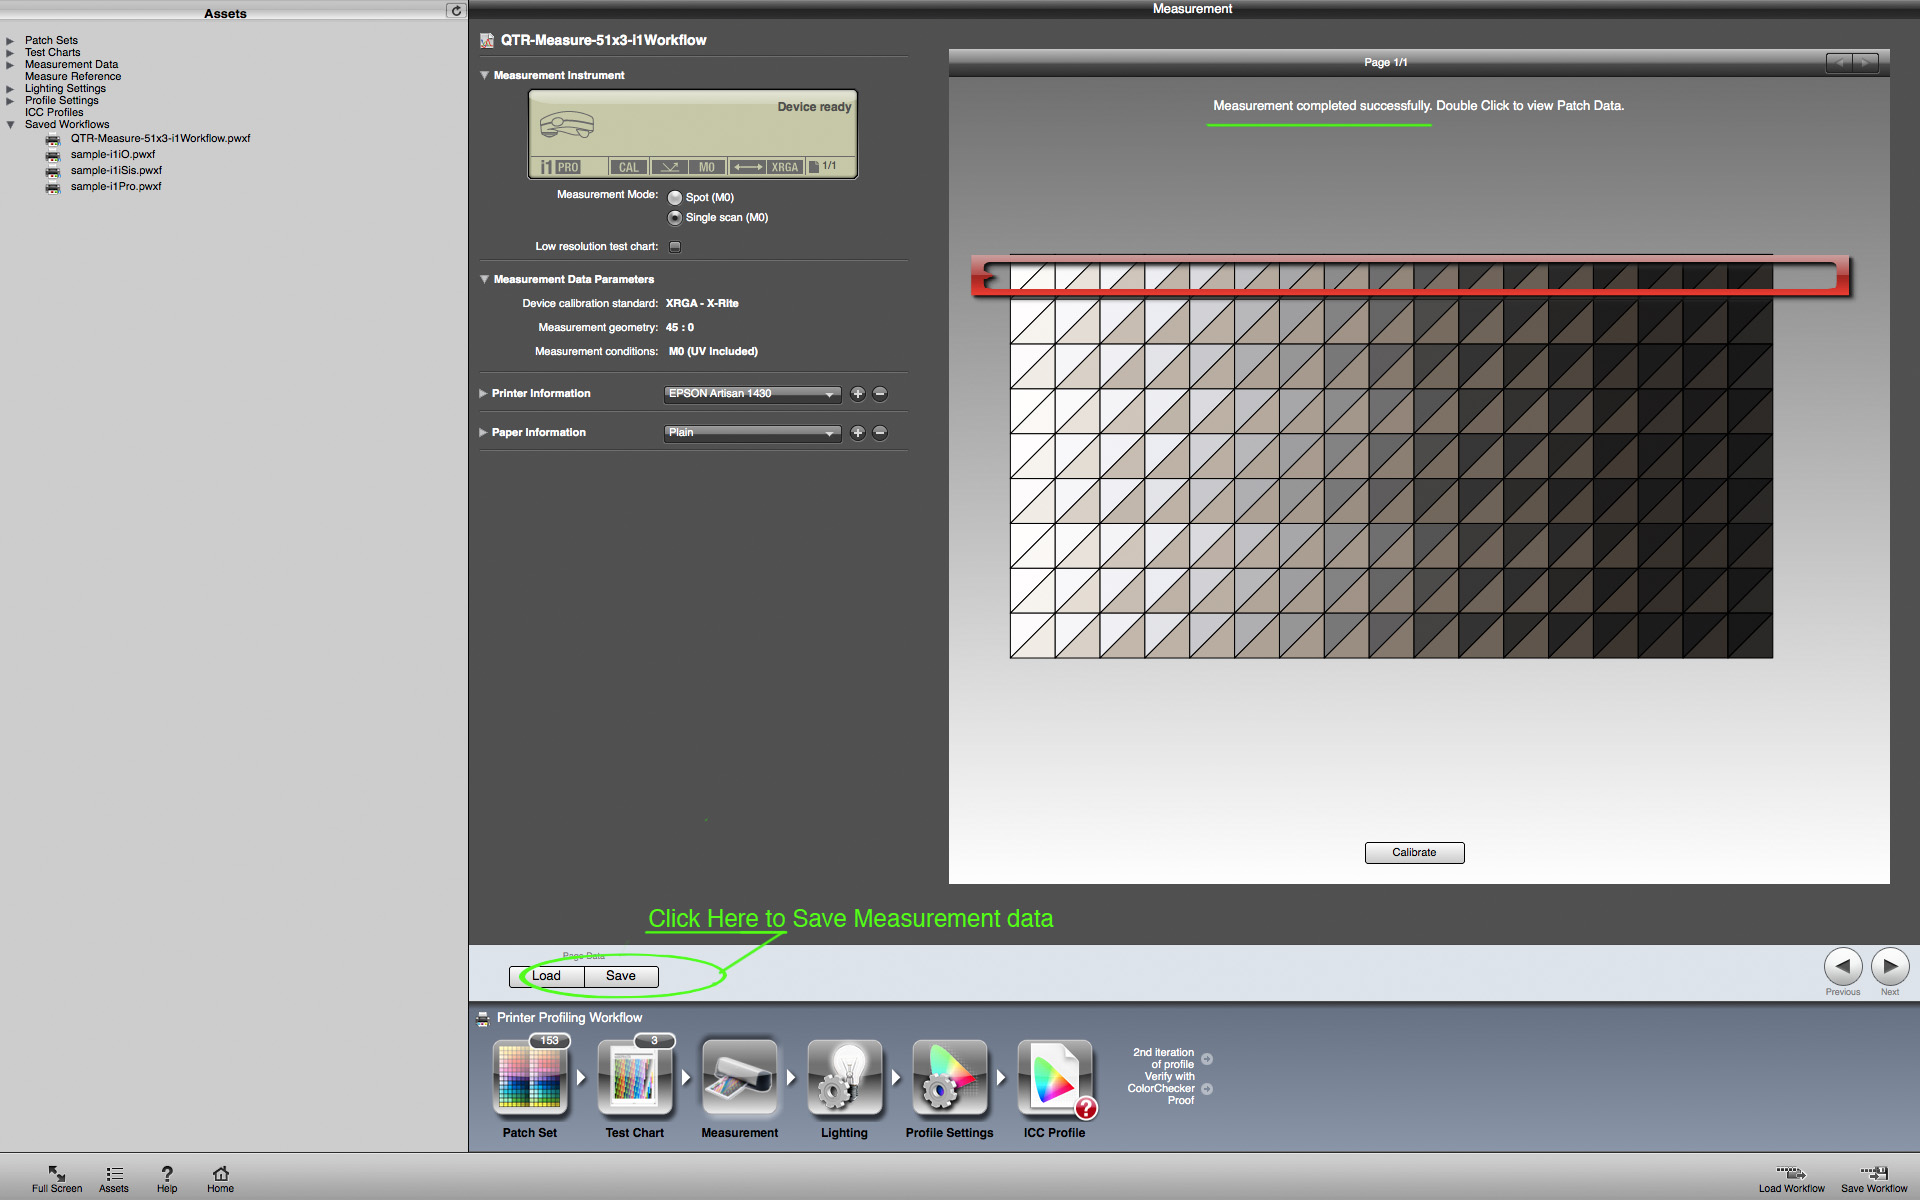
Saving the data in the correct format is essential for the automatic averaging and graphing template to recognize the correct data fields. This is also the correct data format for uploading your measurement file for my QTR Quad file relinearization service.
Create a relevant file name for the paper or the QTR profile/curves used to print the target. I generally suggest using the same name as the QTR or Piezography Profile being measured.
See the screenshot that illustrates the data fields to check.
When you click ok to accept it will save the file name you chose followed by “M0” ex: PaperName-ProfileNameM0 Open the file in a text editor to make sure it looks like the illustration below.
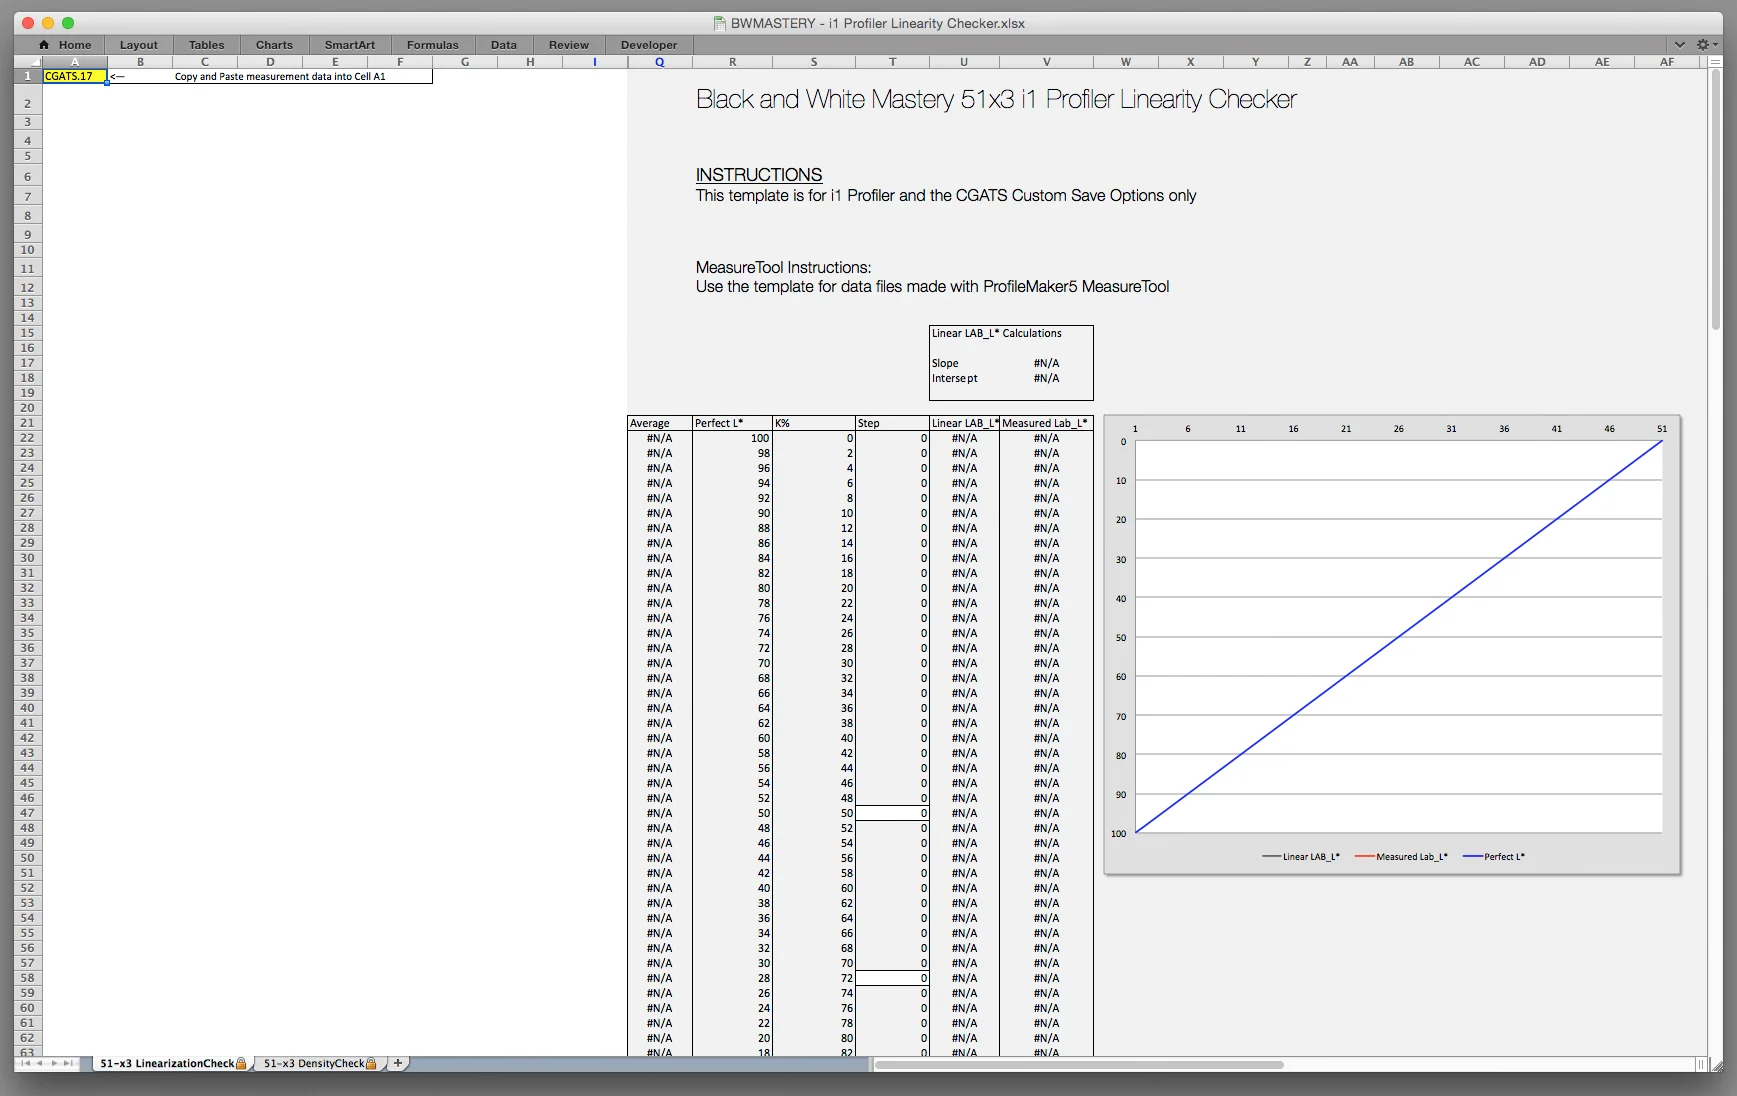
What good is measurement data if you can’t view it? Along with the workflow, I have added an Excel spreadsheet template that does an automatic lookup of the luminosity measurements and then averages and graphs them. The second sheet uses a different lookup to calculate Density from the recorded XYZ_Y measurements.
Please consider contributing a few dollars to enable me to continue to test new inks and papers and to develop free tools to help you take your work to the next level
(and not cluttering the site with annoying ads...)